
CI/CD visibility for small teams
See which pipelines break — and which keep breaking — across all your repos.
Webhook setup, about 10 minutes · 14-day free trial, no credit card · Open-source under the hood, no lock-in
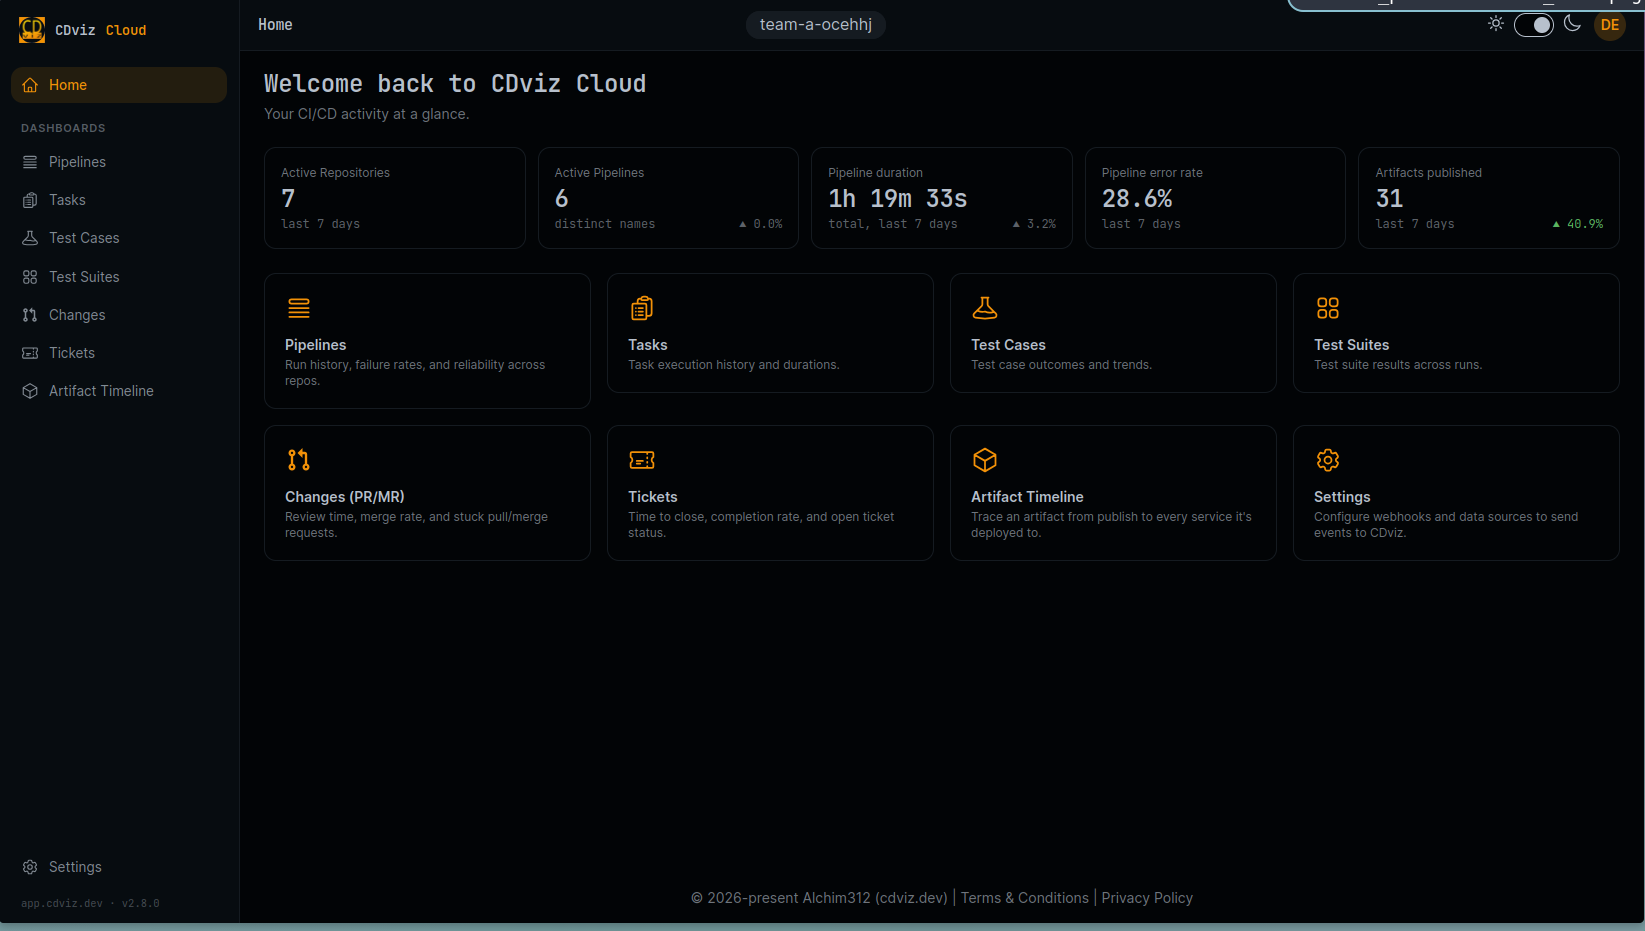
Your CI is red somewhere. You don't know where.
With more than a couple of repos, no single person holds the whole picture anymore. The failures hide in tabs nobody checks until something ships broken.
Failures scattered across repos
Each repo has its own CI tab. To know what's broken, you check them one by one — or you find out when a teammate complains.
You can't tell what keeps breaking
A pipeline that fails 1 in 3 runs costs you hours of reruns and lost trust. Without failure rates over time, chronic breakage stays invisible.
Your CI is quietly getting slower
Builds creep from 4 to 11 minutes over a quarter and nobody notices. Per-repo views never show the trend across everything you ship.
Set it up once, in about ten minutes.
No agents to install, no pipelines to rewrite, no access to your source code.
Create your organization
Sign up and create your org in CDviz Cloud. You'll get a webhook URL and a secret to paste in the next step. (~1 minute)
Add a webhook in GitHub or GitLab
Paste the URL and secret into your organization's webhook settings — two values, one form, on your side. No GitHub App, no OAuth grant, and you can revoke it yourself at any time. (~5 minutes)
Import your history (recommended)
New pipeline runs appear immediately. To see trends from day one instead of waiting a few weeks, add a read-only token so CDviz can import your last 30 days. You create and scope the token yourself.
See reliability across every repo
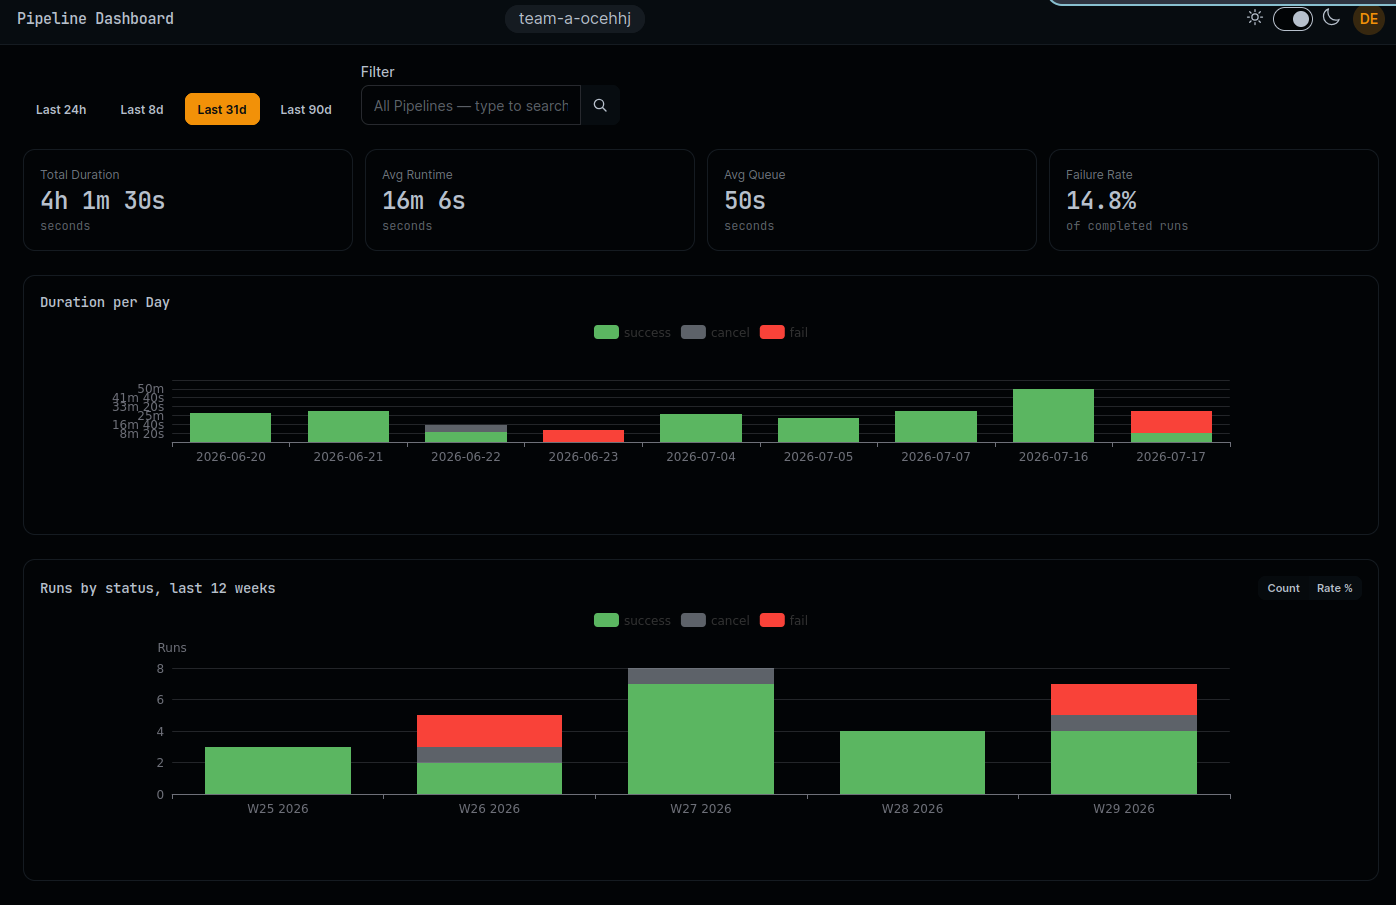
One view ranks what fails most, where, and whether it's trending up. Built on the open CDEvents standard.
See it in action.
Forty seconds, from an empty org to ranked pipeline reliability.
What you get.
Focused on the questions a small team actually asks — not a 50-panel enterprise suite.
Cross-repo pipeline reliability
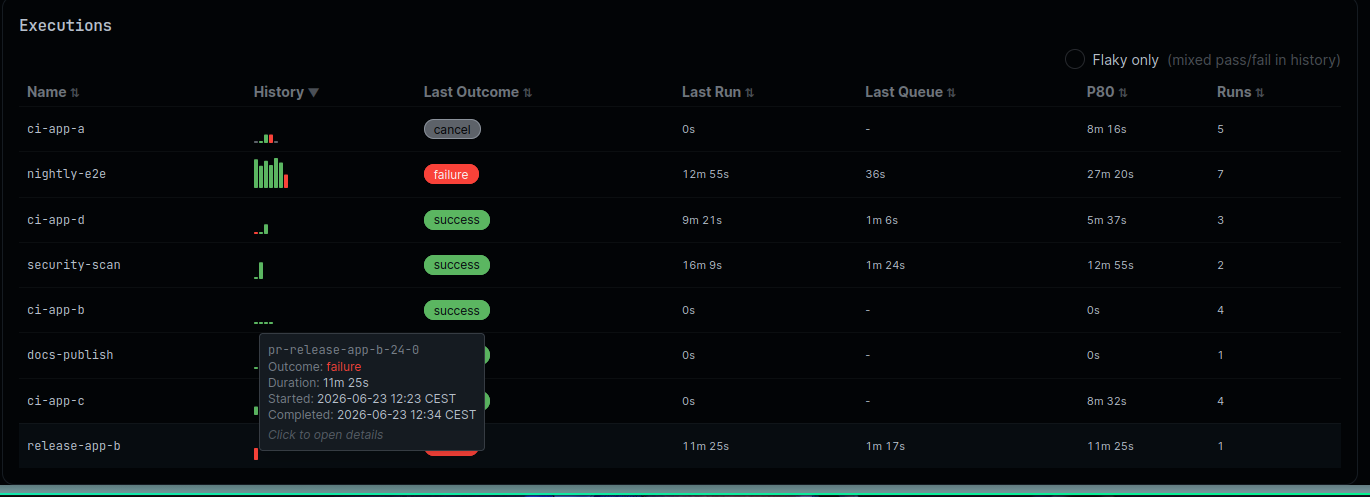
Failure rates, chronically broken and intermittent pipelines, and trends — ranked across all your connected repos. The thing you came for.
Pipeline duration & trends
Spot which pipelines are slow and which are creeping slower over time, before "CI feels sluggish" becomes a sprint-killer.
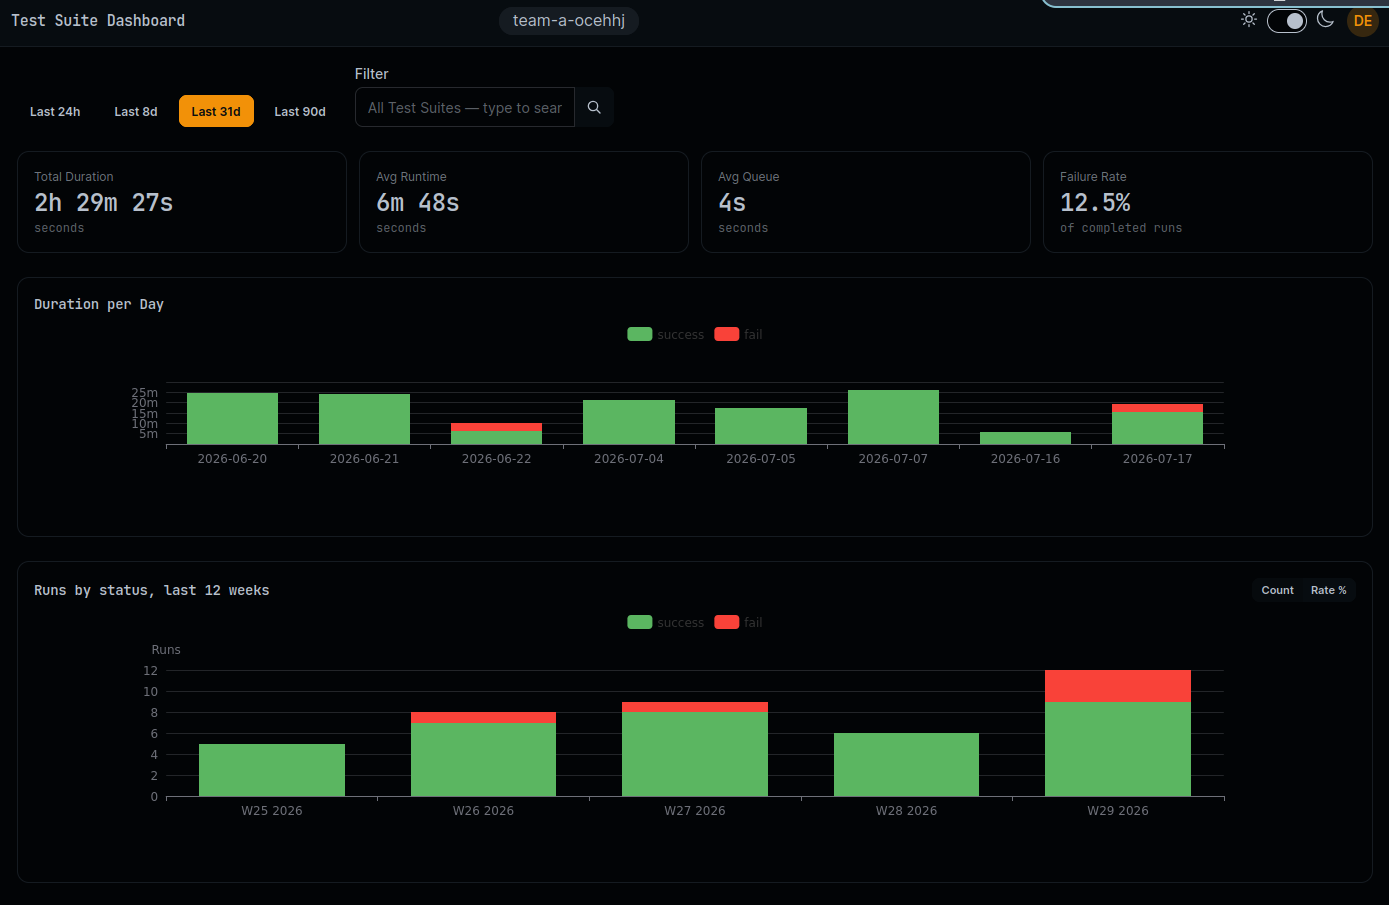
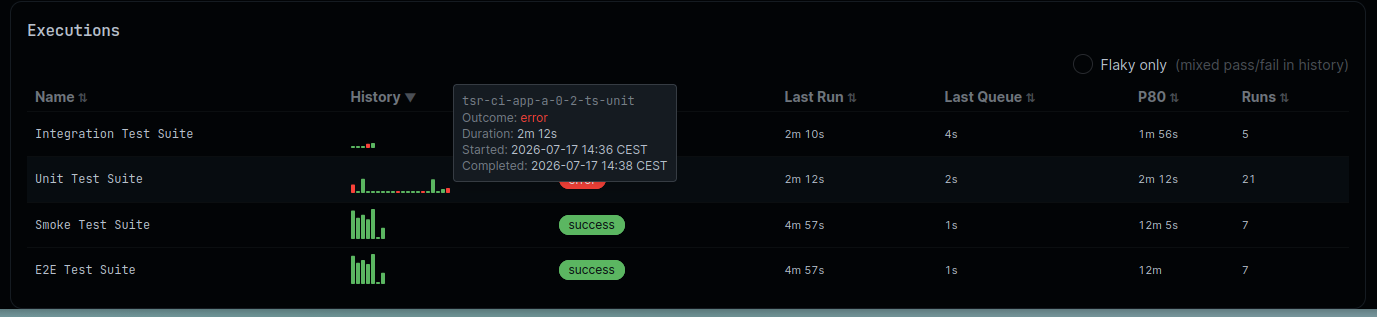
Test suites & flaky detection
Pass/fail history and duration trends per suite, so a test that flip-flops red and green is obvious at a glance — no statistics degree required.
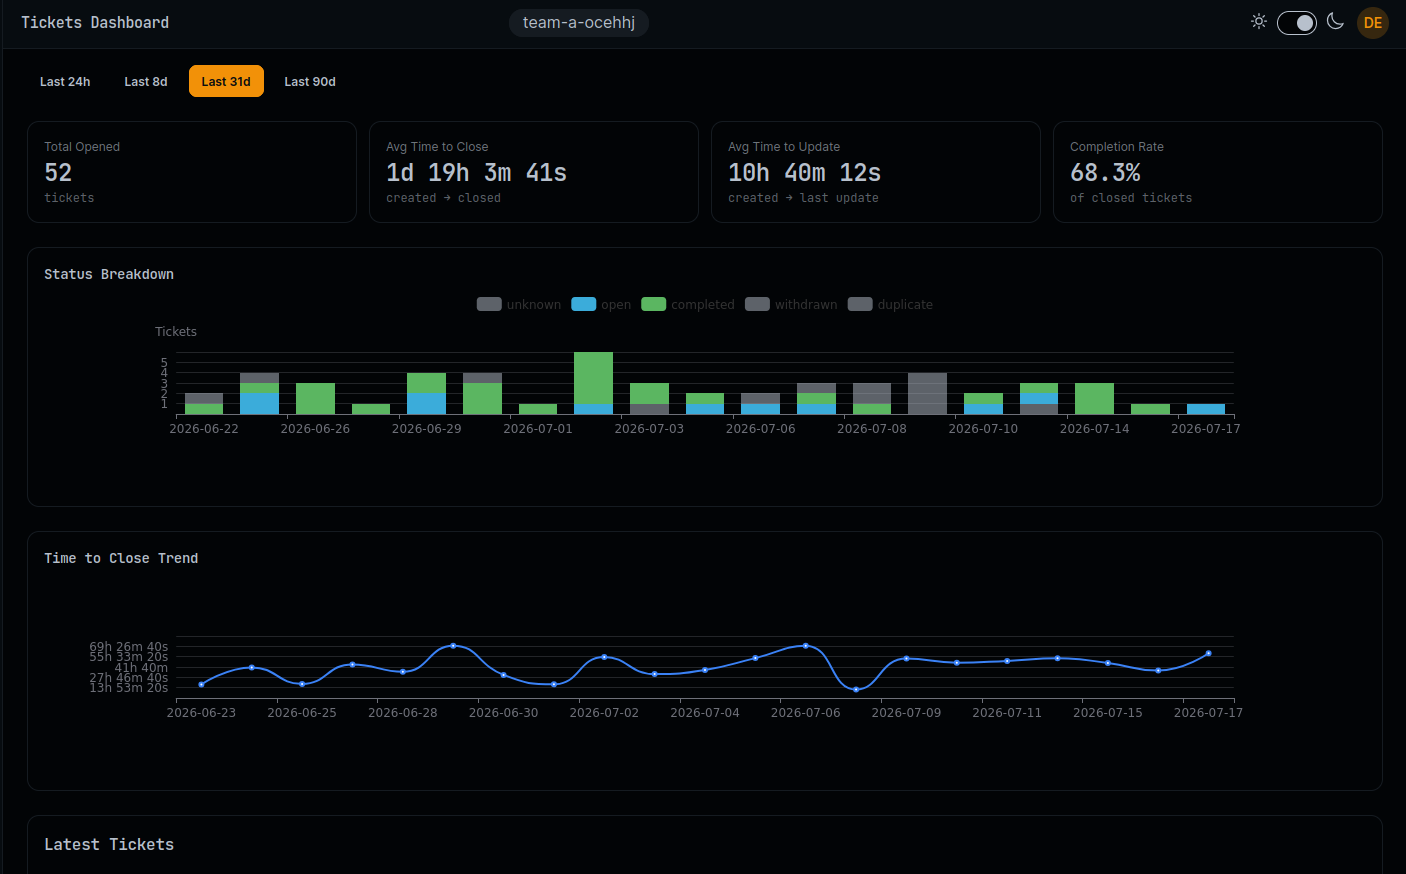
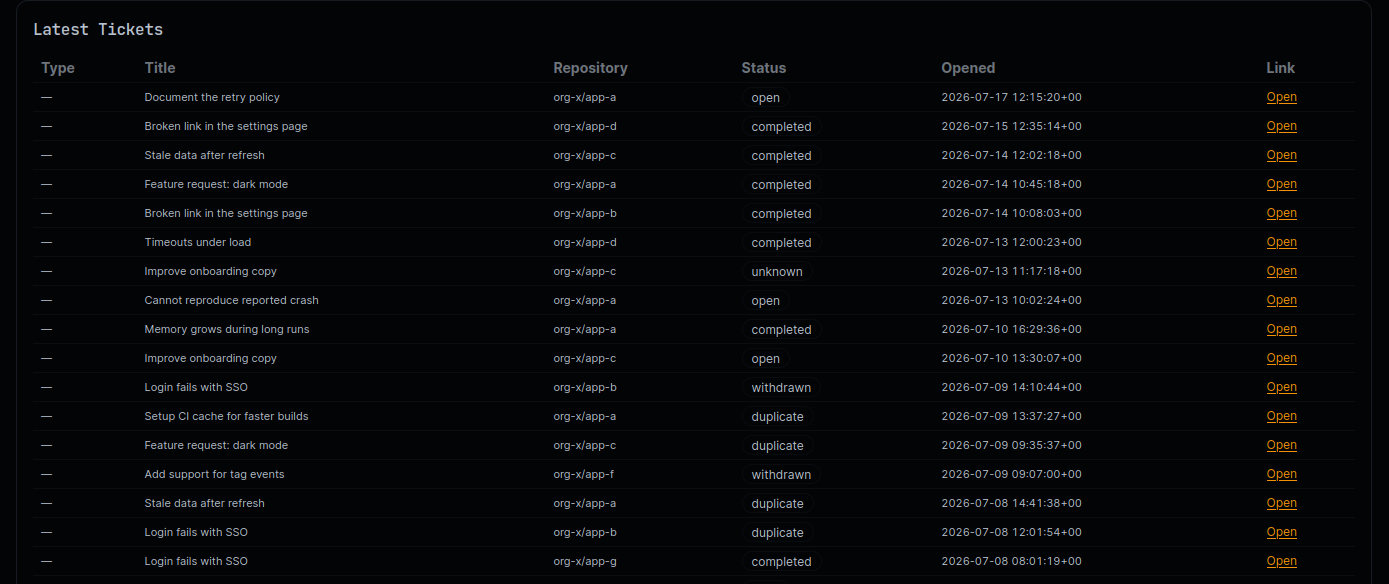
Tickets & issues
How many issues are open, how long the oldest have been sitting, and how fast they close — fed from Jira, GitHub, or GitLab via CDEvents.
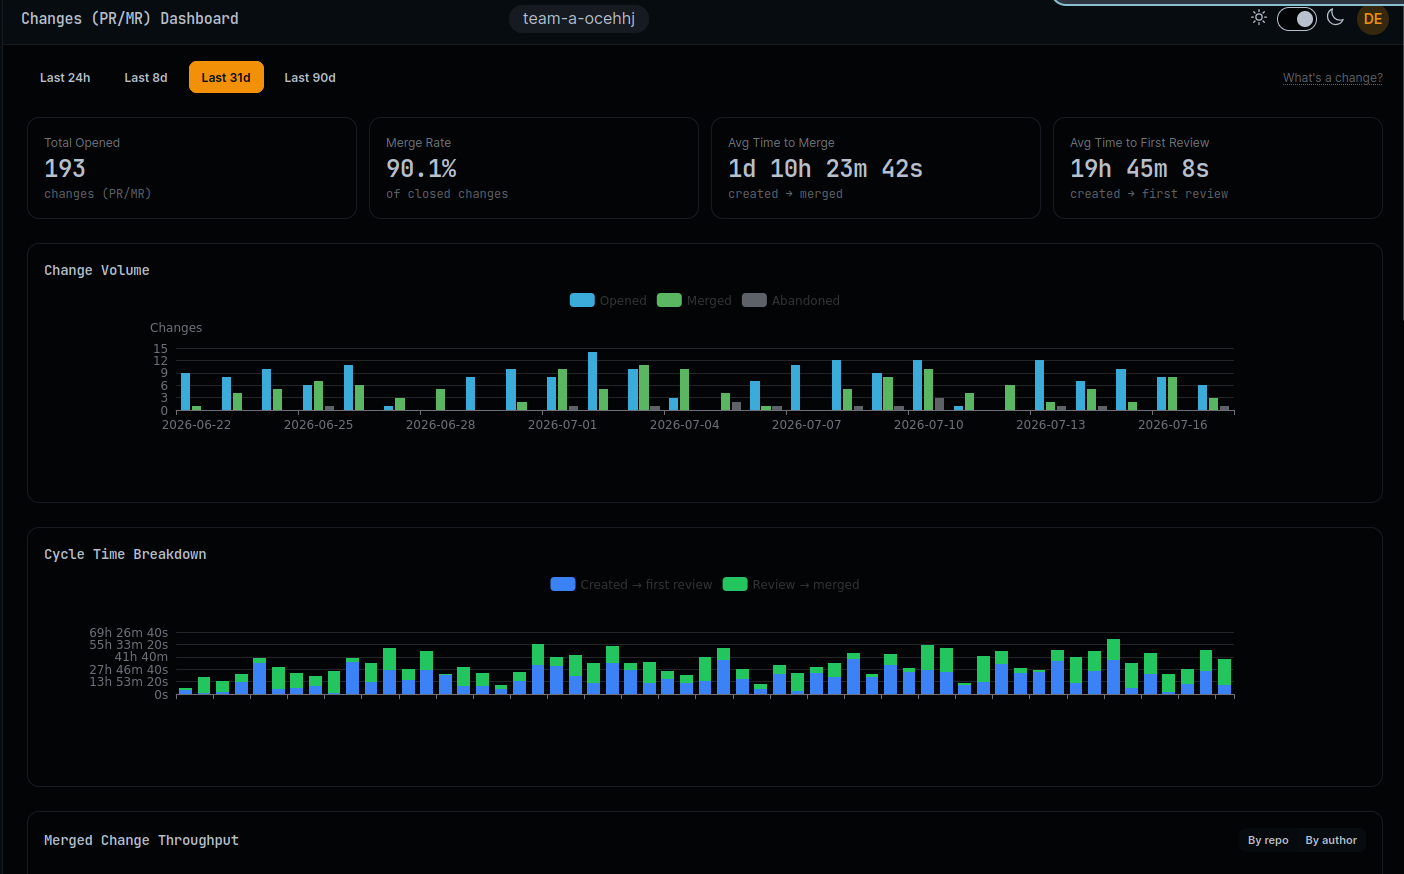
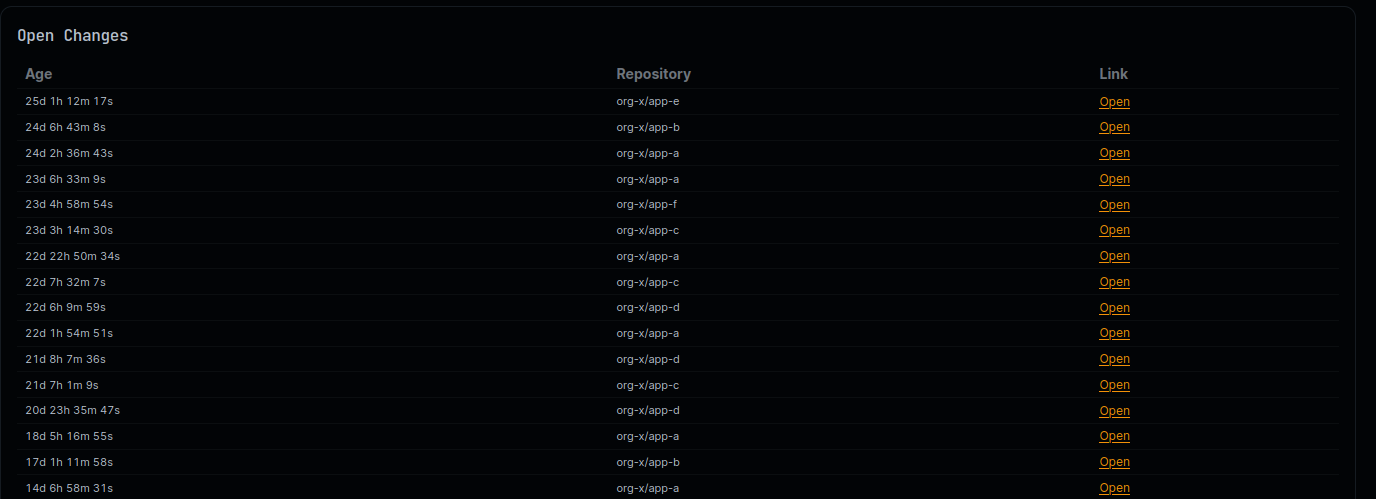
Changes & merge throughput
Pull-request lifecycle across repos: how many changes are created, in review, and merged, your merge throughput, and which changes have been open longest.

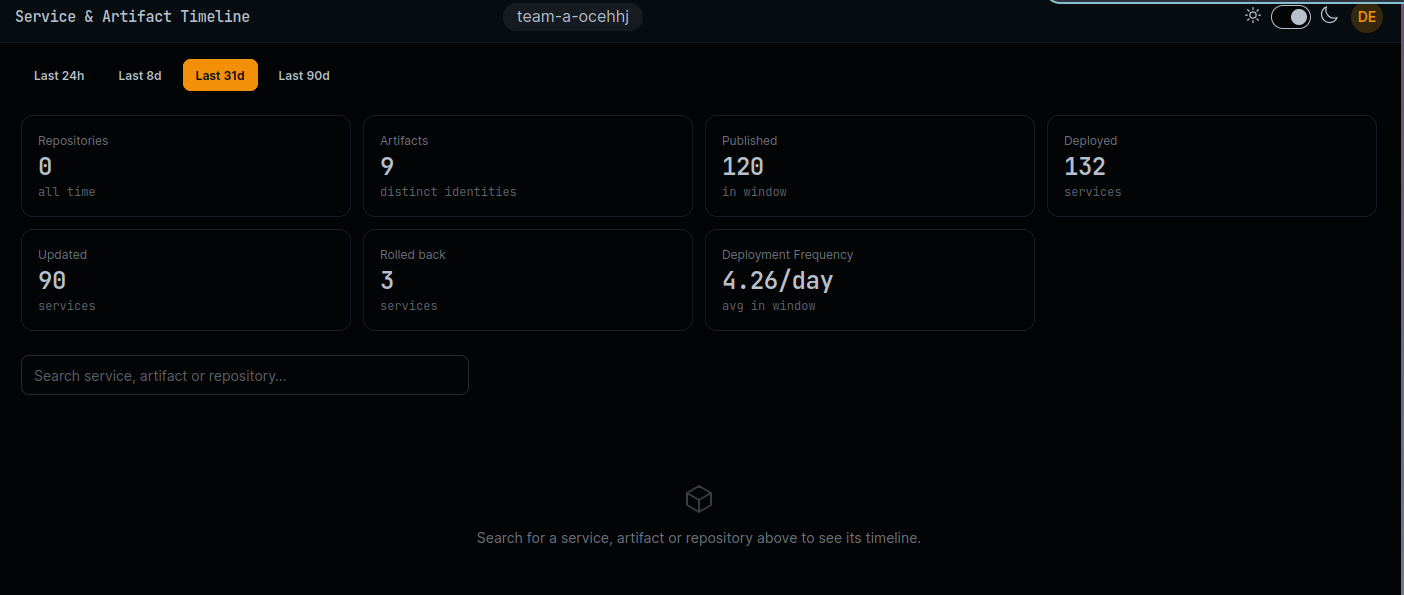
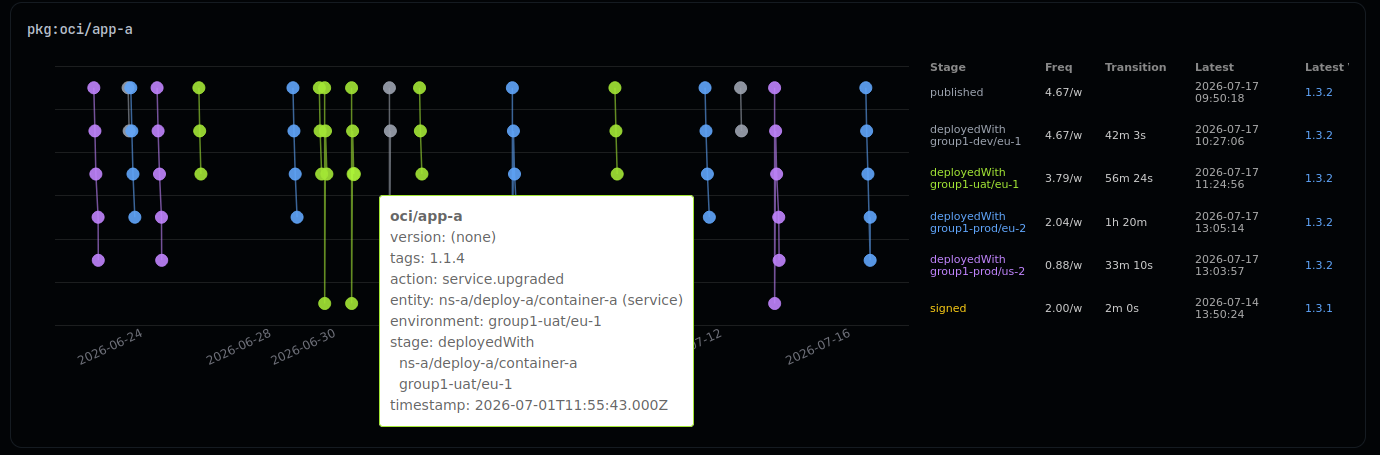
Artifact & deployment timeline
Which version landed in which environment, and when — a per-artifact timeline across services, without infra permissions.
Simple pricing for small teams.
Start free. Upgrade when it's earning its place in your week.
- Hosted & managed — zero infrastructure
- Cross-repo pipeline reliability & trends
- Optional 30-day history import
- GitHub & GitLab
- Email & Discord support
- For teams of 1–5
14-day free trial · No credit card required
Start free trial Want to self-host, or need support & integrations for a larger org?
See the open-source & Pro plans →
Frequently Asked Questions
Why not just use the CI insights built into GitHub or GitLab?▼
The Cloud plan says teams of 1–5. What if we're bigger?▼
What happens when the 14-day trial ends?▼
What access does CDviz Cloud need to my repositories?▼
How long does setup actually take?▼
Where is my data and who can see it?▼
How is Cloud different from self-hosting CDviz?▼
Stop guessing which pipeline is red.
Connect GitHub or GitLab and see what fails, what's slow, and what's getting worse — across every repo you ship. 14-day free trial, no credit card.
Prefer to run it yourself? The stack is Apache 2.0 — see the docs →
Have a use case, questions, or ideas? → [email protected]