
Annotate Runtime Metrics with Events
Try It Live
Send events with the Getting Started demo stack and watch annotations appear on a metrics timeline in real time — no code required.
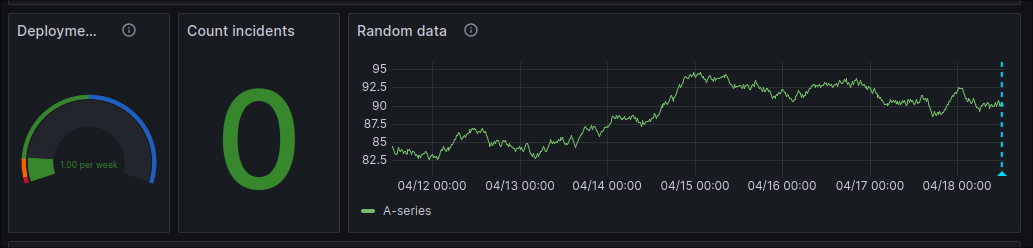
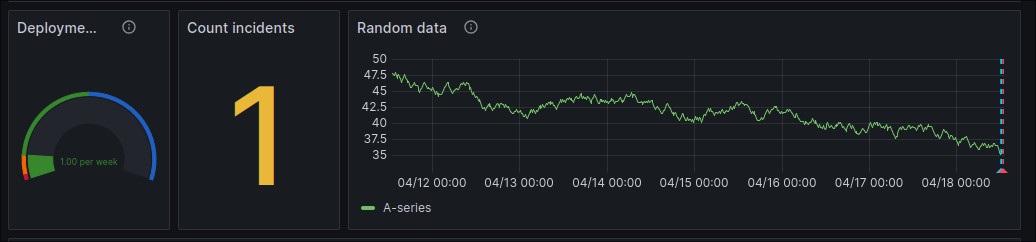
CDEvents stored in the event store aren't limited to CDviz's own dashboards. Any Grafana time series panel — CPU, latency, error rate, whatever your Prometheus/Datadog/CloudWatch datasource already renders — can show the same deployment and incident markers, so a spike is explained by "yes, we deployed at 14:02" instead of a guessing game.
How It Works
Grafana annotation queries run a query that returns rows with a time, title, text, and tags, then plot each row as a vertical marker on every time series panel in the dashboard. Point one at your cdviz-db PostgreSQL datasource and query cdviz.cdevents_lake directly — no extra service, no polling job.
Example: Annotate with Service Deployments
Add an annotation query with this SQL, mapping time/title/text/tags to the matching columns:
SELECT
  timestamp as time,
  payload -> 'subject' ->> 'id' as title,
  array_to_string(
    ARRAY[
      'event:' || subject || '.' || predicate,
      'environment:' || (payload -> 'subject' -> 'content' -> 'environment' ->> 'id'),
      'service:' || (payload -> 'subject' ->> 'id')
    ], ','
  ) as tags,
  payload -> 'subject' -> 'content' ->> 'artifactId' as text
FROM cdviz.cdevents_lake
WHERE $__timeFilter(timestamp)
  AND subject = 'service' AND predicate IN ('deployed', 'upgraded', 'rolledback')
Example: Annotate with Incidents
SELECT
  timestamp as time,
  payload -> 'subject' ->> 'id' as title,
  array_to_string(
    ARRAY[
      'event:' || subject || '.' || predicate,
      'environment:' || (payload -> 'subject' -> 'content' -> 'environment' ->> 'id'),
      'service:' || (payload -> 'subject' -> 'content' -> 'service' ->> 'id')
    ], ','
  ) as tags,
  payload -> 'subject' -> 'content' ->> 'ticketURI' as text
FROM cdviz.cdevents_lake
WHERE $__timeFilter(timestamp)
  AND subject = 'incident' AND predicate IN ('detected', 'reported')
Add It to Your Own Dashboard
- Open your dashboard's settings → Annotations → New query.
- Set the datasource to your
cdviz-dbPostgreSQL connection. - Paste one of the queries above (or both, as separate annotation layers with different colors).
- Under Mappings, map
time→ time,title→ title,text→ text,tags→ tags. - Optionally filter by
${environment}/${service}dashboard variables to scope annotations to what the panel is actually showing.
Source Code Reference
- Reference implementation: demo_service_deployed.json — a playground dashboard with both annotation queries wired up, plus forms to send test events.