
Test Results
Which tests are flaky? Which suites got slower over the last weeks? What fails most often — and is it getting worse?
The Test: Executions and Test Suite: Executions dashboards answer these questions from the test run events emitted by your CI — for example via the JUnit report integration.
What's on the dashboard
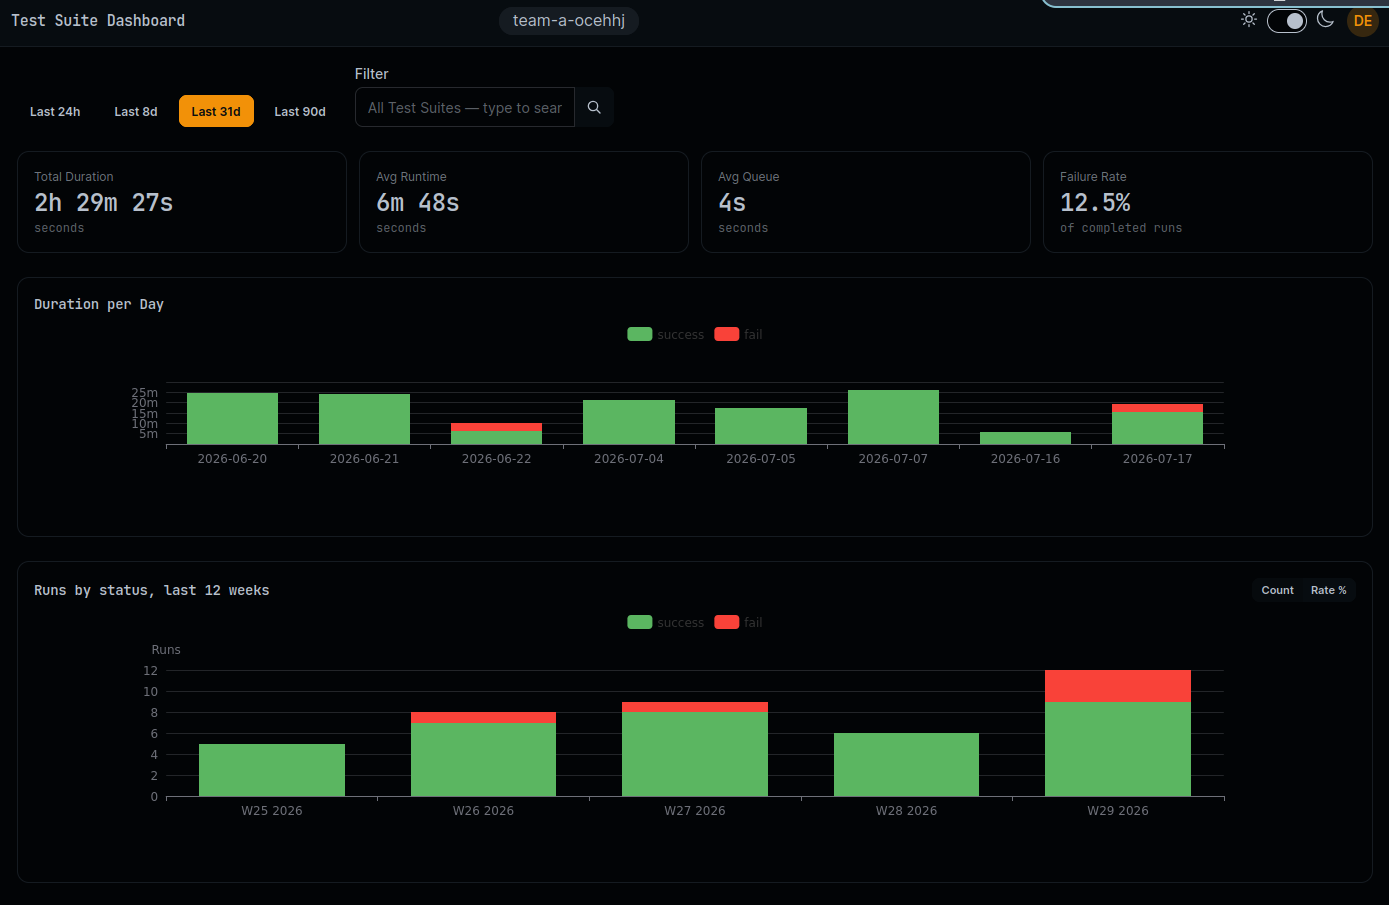
Overview stats — the health of your test base at a glance:
- Total Duration - Aggregate time spent running tests
- Average Runtime - Mean run time per test or suite
- Average Queue Time - Mean time waiting to start
- Failure Rate - Percentage of failed runs (fail, failure, error) with color-coded thresholds
Daily trends — spot slowdowns and failure spikes:
- Total duration per day
- Number of runs per day, split by outcome (success, fail, error, skip, cancelled)
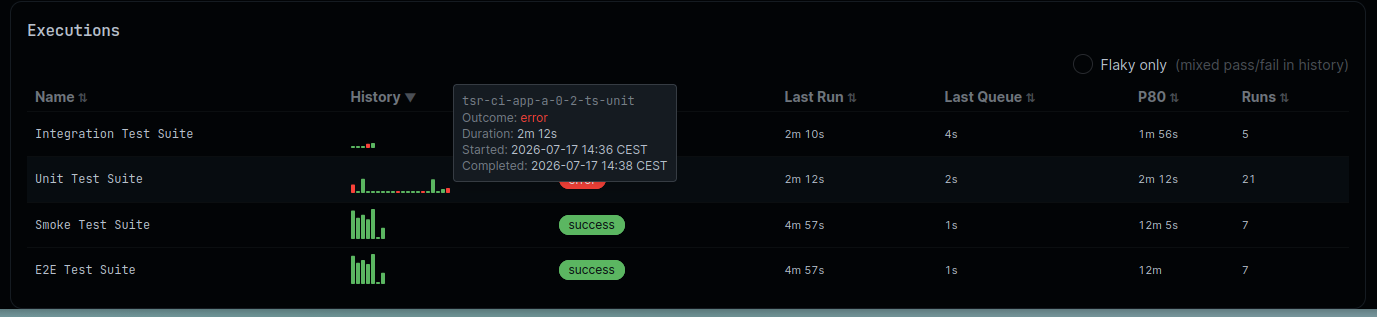
Per-test table — hunt the flaky ones:
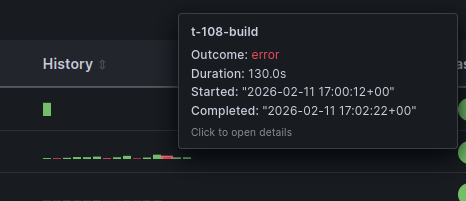
- History - Sparkline of recent run outcomes: a test alternating red and green is flaky, no statistics degree required
- Last Outcome / Duration / Queue - Most recent run details
- P80 Duration - 80th percentile run time — catches suites that got slow, robust to one-off outliers
- Total Runs, Passed, Failed, Skipped - Counts over the selected time range

Hover a sparkline for per-run details (timestamps, durations, outcomes):
Use the Test Suite dashboard to watch suite-level duration and stability, and the Test dashboard to drill down to the individual test cases responsible.
Also in CDviz Cloud
The same insights are built into CDviz Cloud — managed, nothing to install:
Under the hood
These dashboards share their panels and queries with Pipeline & Task Runs, backed by the cdviz.testcaserun and cdviz.testsuiterun database views instead. See the dashboard generator source.
Feeding test events
Test dashboards need testcaserun / testsuiterun CDEvents. The easiest way to produce them is to let the collector import your existing test reports: see the JUnit report integration for per-ecosystem examples.