
Pipeline & Task Runs
Which pipelines are the slowest or the flakiest? How long do runs wait in queue before starting? Is the failure rate trending up? Which task drags the whole pipeline down?
The Pipeline: Executions and Task: Executions dashboards answer these questions from the pipeline and task run events your CI/CD tools already emit.
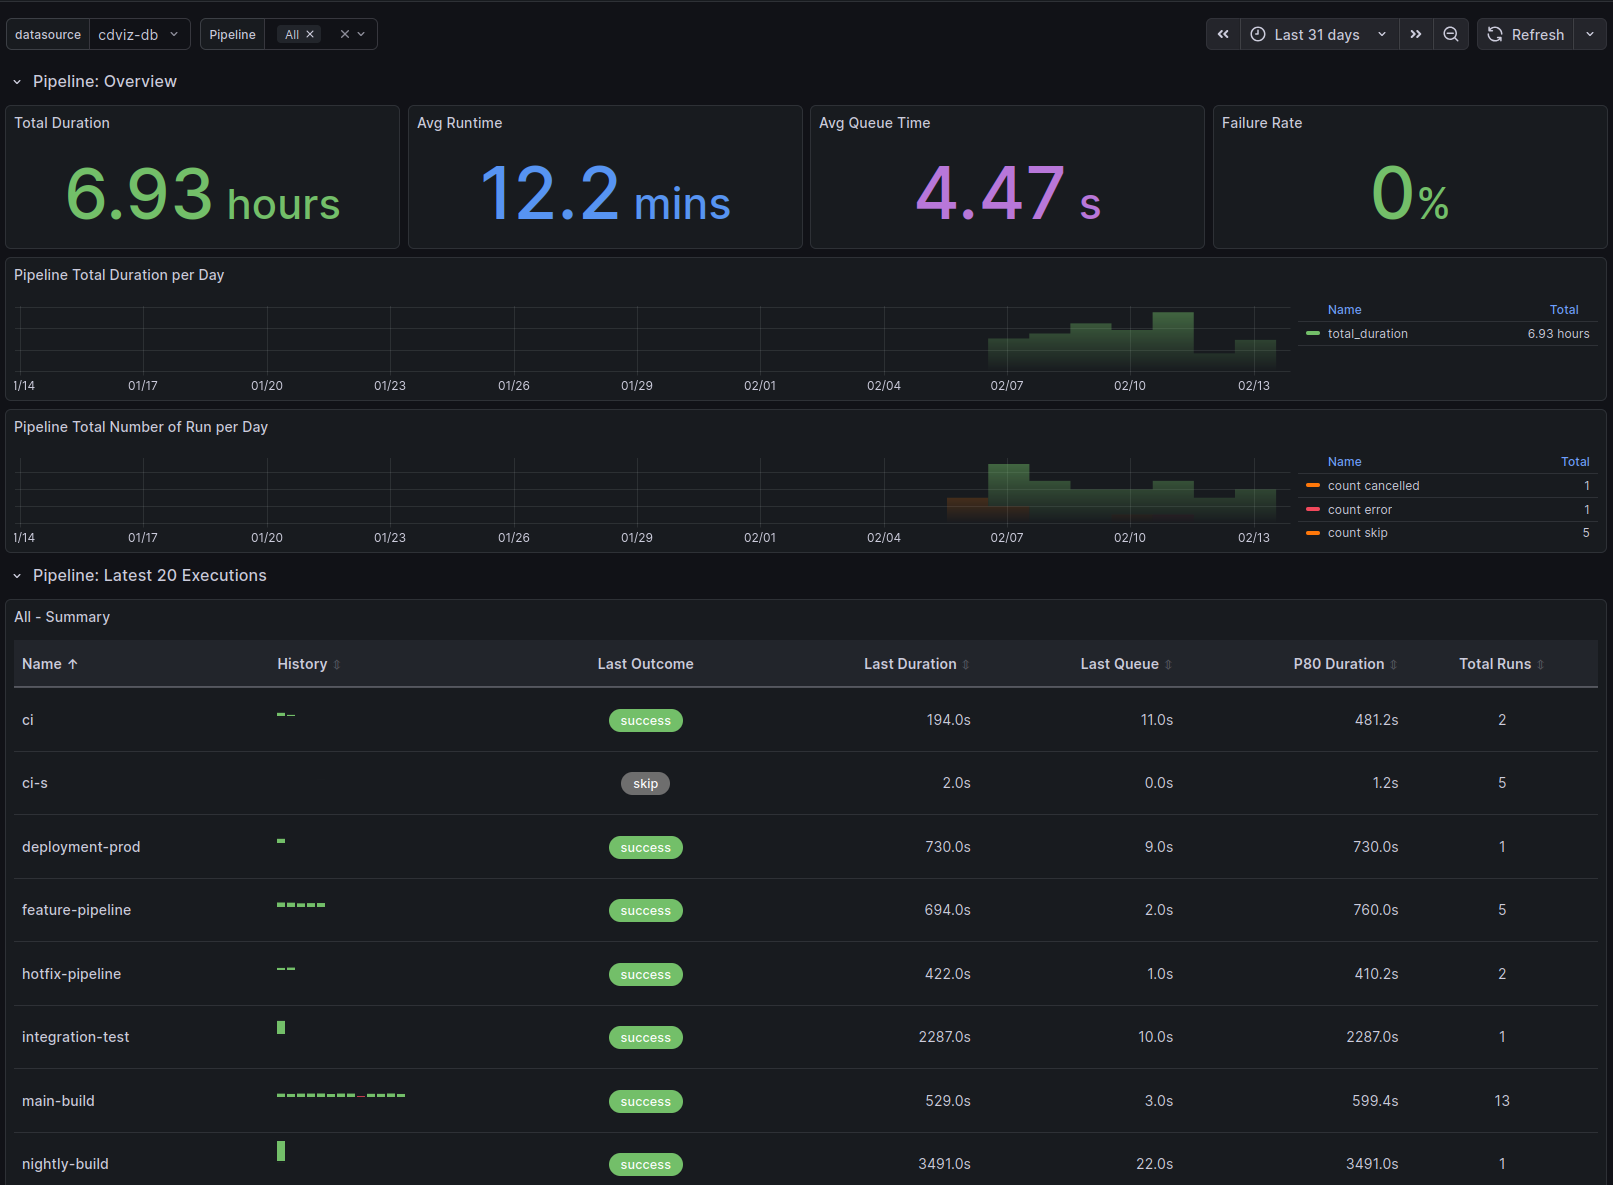
What's on the dashboard
Overview stats — the health of your CI at a glance:
- Total Duration - Aggregate time spent across all runs (your CI bill, roughly)
- Average Runtime - Mean run time
- Average Queue Time - Mean time waiting to start — high values point at runner/agent capacity problems
- Failure Rate - Percentage of failed runs (fail, failure, error) with color-coded thresholds
Daily trends — spot regressions and creeping slowness:
- Total duration per day
- Number of runs per day, split by outcome (success, fail, error, skip, cancelled)
Per-pipeline table — find the culprit:
- History - Sparkline of recent run outcomes: flakiness is visible at a glance
- Last Outcome / Duration / Queue - Most recent run details
- P80 Duration - 80th percentile run time — a stable "how slow is it really" number, robust to outliers
- Total Runs, Passed, Failed, Skipped - Counts over the selected time range

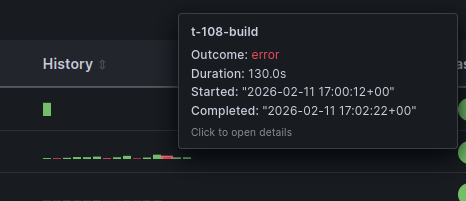
Hover a sparkline for per-run details (timestamps, durations, outcomes), and click through to the run in your CI tool via its URL:
The Task: Executions dashboard offers the same views at the individual task level, useful to find which step inside a pipeline is slow or unreliable. Task runs don't carry queue time, so queue-related panels are omitted there.
Also in CDviz Cloud
The same insights are built into CDviz Cloud — managed, nothing to install:
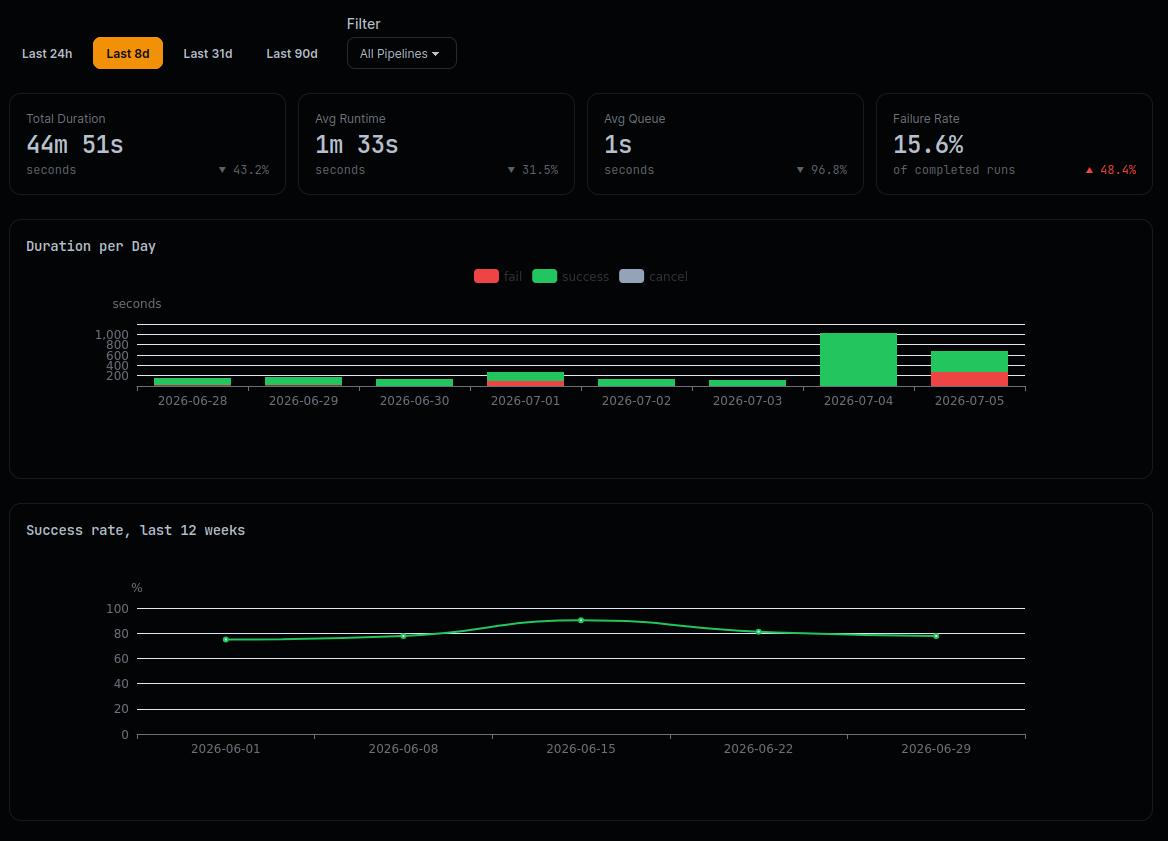
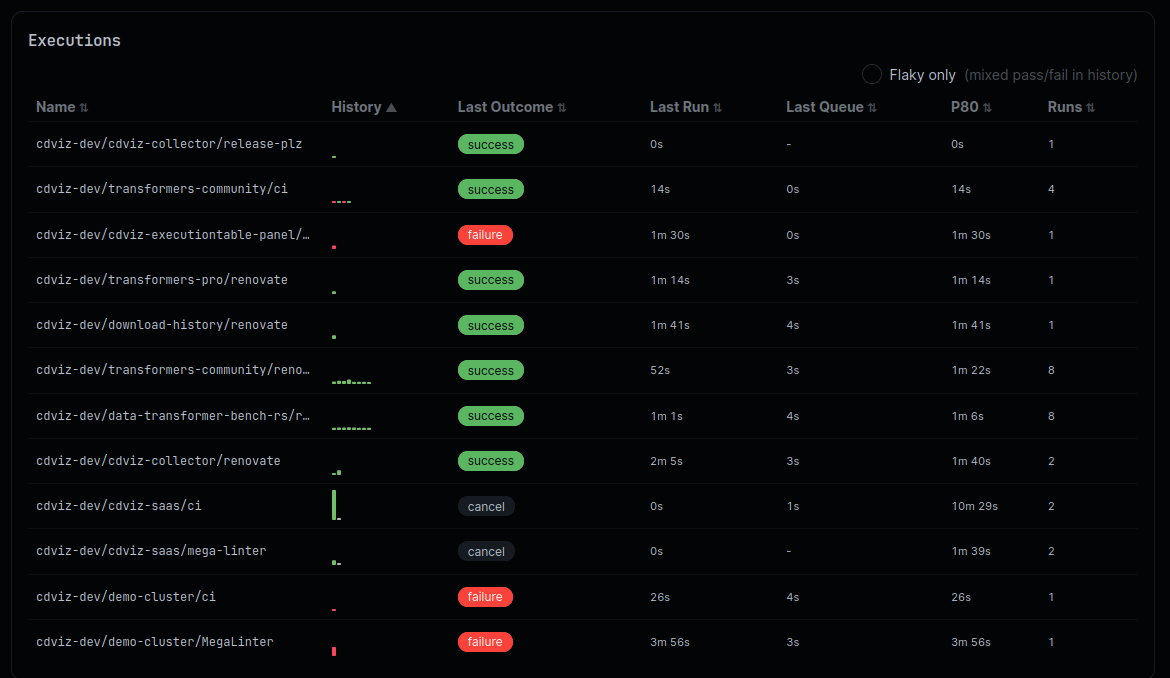
Implementation Details
Overview Stat Panels
The overview section uses aggregation queries on the cdviz.pipelinerun view. Example query for average runtime:
SELECT
  COALESCE(AVG(extract('epoch' from (finished_at - started_at))), 0) AS avg_runtime
FROM cdviz.pipelinerun
WHERE
  ($__timeFilter(queued_at) OR $__timeFilter(finished_at))
  AND last_payload -> 'subject' -> 'content' ->> 'pipelineName' = ANY(ARRAY[${selected_value:sqlstring}]::text[])
  AND finished_at IS NOT NULL
Time Series Queries
Daily aggregations use TimescaleDB's time_bucket function for efficient grouping:
SELECT
  time_bucket('1 day', finished_at) AS time,
  SUM(extract('epoch' from (finished_at - started_at))) AS total_duration
FROM cdviz.pipelinerun
WHERE
  ($__timeFilter(queued_at) OR $__timeFilter(finished_at))
  AND last_payload -> 'subject' -> 'content' ->> 'pipelineName' = ANY(ARRAY[${selected_value:sqlstring}]::text[])
  AND finished_at IS NOT NULL
GROUP BY time
ORDER BY time
Execution Table
The table uses the custom cdviz-executiontable-panel Grafana plugin. Its query aggregates, per pipeline name: the last 20 runs as arrays (durations, queue times, outcomes, run IDs, URLs) for the sparkline, plus P80 duration and passed/failed/skipped counts. See the full query in the dashboard generator source.
Panel features:
- History Visualization - Sparkline charts showing execution outcome trends
- Interactive Tooltips - Hover for detailed execution information including timestamps, durations, and outcomes
- Configurable Display - Adjustable history items (default: 20), bar height, and gap settings
Database Views
- The SQL queries rely on views defined over the
cdevents_laketable (e.g.,cdviz.pipelinerun,cdviz.taskrun) - Each view provides denormalized access to execution data with fields like
started_at,finished_at,queued_at,outcome - For missing views, consider:
- Submitting a pull request to add the view to the database schema
- Creating custom views in your environment
- Using SQL
WITHstatements in your queries as a workaround
Dashboard Variables
selected_value- Multi-select variable for filtering by pipeline/task namelimit- Hidden variable controlling the number of executions displayed in the table (default:20)- Time Range - Standard Grafana time picker integration with
$__timeFilter()function
Coming Soon
- Tag-based Filtering - Filter and group executions by:
- Environment (dev, staging, production)
- Artifacts (application versions, container images)
- Teams (ownership and responsibility)
- Custom metadata tags
Source Code References
- Database schema: migrations
- Dashboard generator: execution_dashboards.ts